

If you’re striving to make data-driven decisions in your business, there’s a tool that can help you streamline this process: stacked charts. A stacked chart is a graphical representation of data where the various categories being measured are indicated by colors or patterns. It’s a potent tool that has the potential to punctuate your decision-making strategies with hard facts. Below, we delve deeper into what stacked charts are and their importance to business operations.
Table of Contents
Understanding the Basics of Stacked Charts
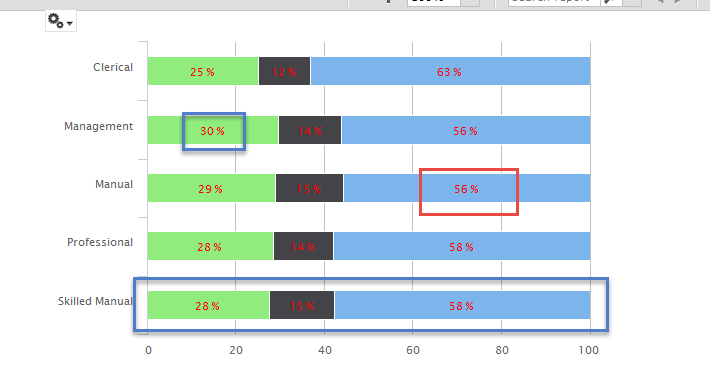

A stacked chart is a variant of a bar graph used to display the total of distinct categories. It integrates different datasets into a single graphic, showcasing the composition of each data set and comparing it to others. The chart breaks down and compares parts of a whole. Every bar in the stacked chart represents a total, and segments in the bar represent different parts or categories of that total.
By using stacked charts in your business operations, you get an opportunity to understand and visualize part-to-whole relationships. It provides an orderly structure to numerous groups and helps in revealing the composition of every group. For instance, when you want to represent the total profits from various departments, a stacked chart can be instrumental.
Enhancing Data Analysis

Stacked charts act as an important tool for detailed data analysis in business. With the ability to display multiple data series, they offer a comprehensive overview of data from different categories. Here, each data series is represented by a color or pattern, making the chart visually appealing while delivering clear insights. By looking at the stacked chart, you can easily tell the total value across categories and how each category contributes to the total.
Furthermore, since stacked charts can portray cumulative totals over time, they become invaluable in analyzing trends. When you have time on the horizontal axis, you can see how the total value and composition change over time. In a rapidly changing business landscape, being able to discern trends and adapt quickly becomes invaluable.
This analytic feature of stacked charts not only enables you to make data-driven decisions but also improves your strategic input to stakeholders. Being able to visually demonstrate a clear understanding of trends and predictions could be particularly beneficial in pitching ideas to investors, explaining strategies to team members, or justifying decisions to stakeholders.
Streamlining Business Operations
Stacked charts also have substantial impacts on streamlining business operations. They allow for easy comparison of data and enable organizations to recognize patterns and insights that would otherwise have been hard to spot. For instance, using a stacked chart might help unearth intriguing trends in customer behavior, resource allocation, or staff performance.
For businesses with several departments or divisions, a stacked chart can facilitate departmental comparisons. It furnishes a vivid representation of how different departments contribute to overall revenue or costs. This way, an organization can identify its most profitable departments and those that may need improved efficiency.
Another important aspect worth considering is its role in maximizing the effectiveness of resource allocation. For example, by offering a transparent view of how different departments perform, a company can better strategize its resource allocation, ideally shifting resources from less productive areas to ones that offer higher returns.
The stacked chart is a powerful data visualization tool. These charts allow businesses to enhance data analysis, streamline operations, simplify complex data, and facilitate effective communication. By availing a snapshot of business activities and performance, they aid in the strategic decision-making process, empowering your business growth and success. Overall, these benefits make stacked charts an indispensable tool for businesses operating in our current data-driven age.